GIS Data Visualization with Scatterplots
DIY scatterplot maker
About this Project
Spatial representation of data is a main focus of GIS. Visual analytics offers a complementary perspective by separating the data from its spatial element in order to show relationships between variables in a more direct format. Scatterplots are useful tools for accomplishing this goal.
This project introduces scatterplots as a complementary tool to GIS. The first section discusses their capabilities with a demonstration of their use in a GIS legend. The second section is an interactive data visualization -- make your own scatterplots! Explore 2010 census block group data in your county with this easy-to-use web tool.
The goals of this project are:
- demonstrate the ability of scatterplots to show relationships and patterns
- demonstrate that scatterplots can enhance GIS legends for bivariate maps
- allow easy exploration of Florida 2010 Census block group data with the DIY Scatterplot Maker tool
Scatterplots Show Relationships
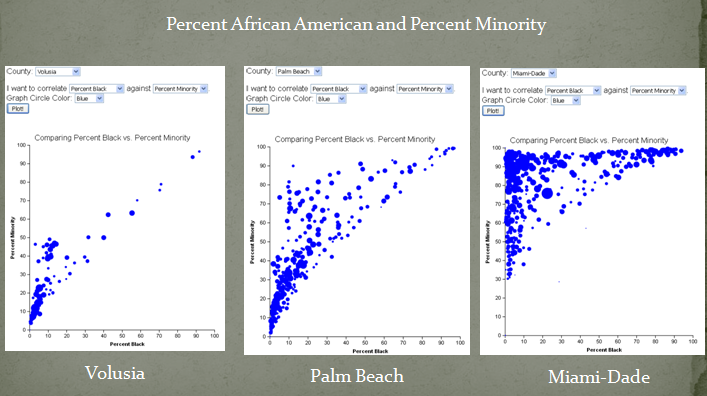
The scatterplots below show the distribution of percentages of African American and Minorities across 3 counties. Each county has its own pattern that tells a different story. Miami-Dade County has a high percentage of minorities that are not African American. Volusia County has a much different distribution.
Relationships between African American and Minorities in Three Counties
Scatterplots in GIS Legends
Scatterplots can complement GIS maps by providing an alternative perspective of data relationships. Scatterplots separate the data from the spatial element of the map, in order to make a clearer picture of the relationships between the data. When incorporated into the map legend, scatterplots offer an additional perspective by visualizing the data patterns.
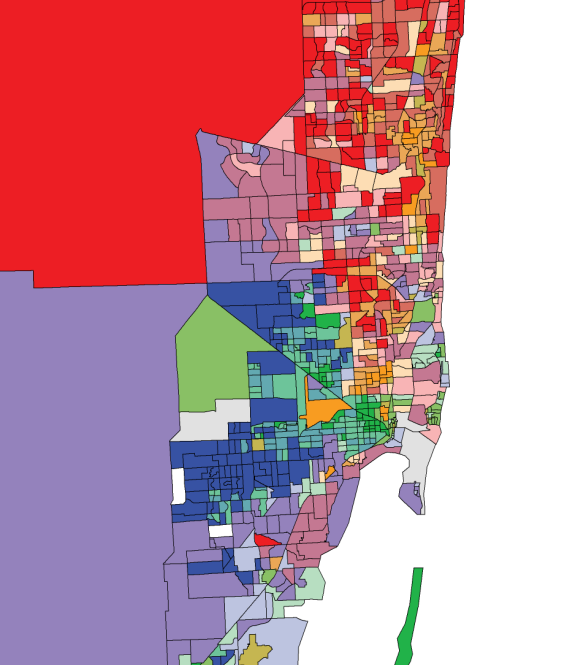
The map below shows the relationship between Hispanics and Renting by census block group. The color scheme emphasizes the corner areas showing the high and low percentages (e.g. high/low renting and high/low Hispanic). Use the buttons to toggle between a traditional legend and one including a scatterplot.
Hispanics and Renters in Miami-Dade County
Legend(s)
Fewer Renting
Many Renting
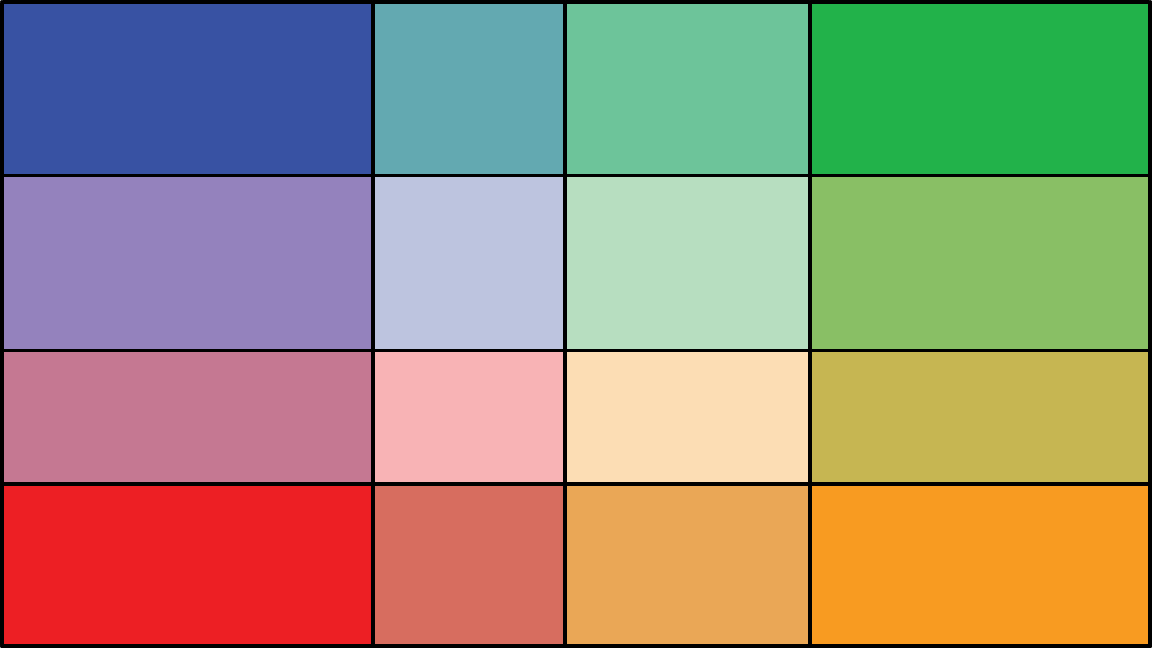
Fewer Renting
Many Renting
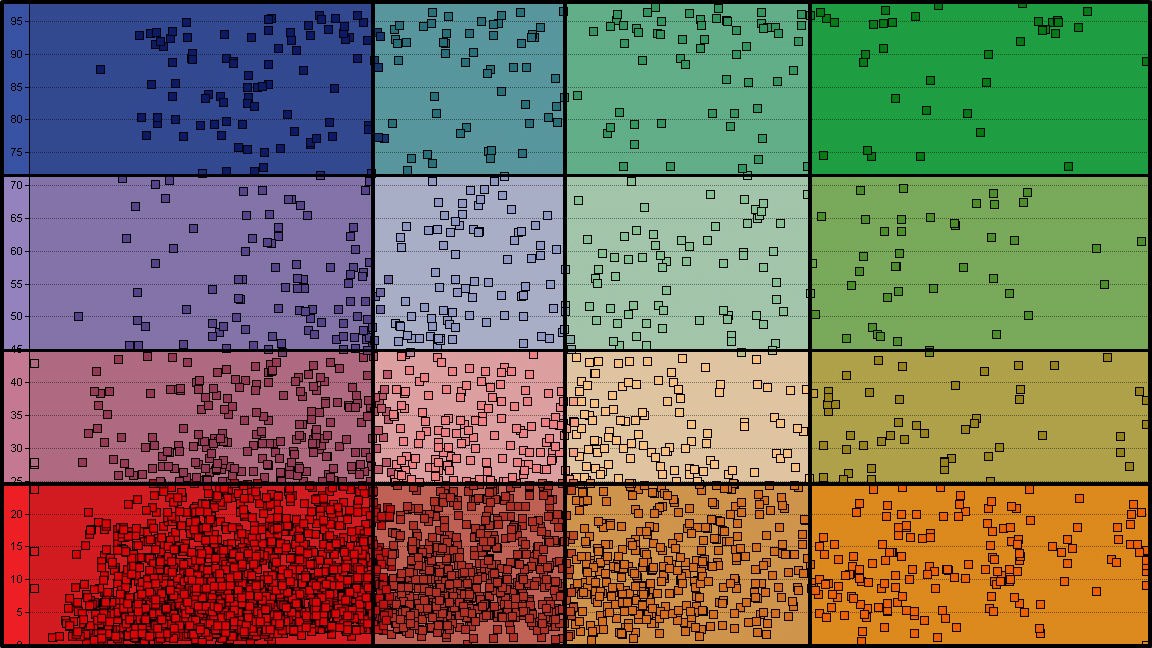
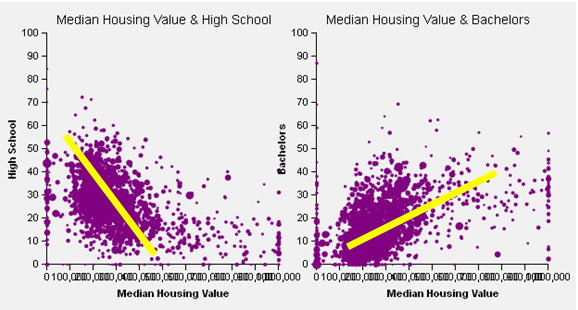
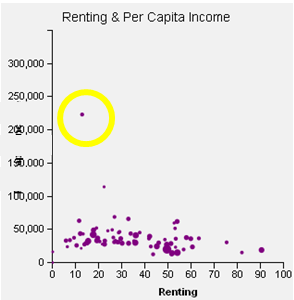
DIY Scatterplot Maker -- Sample Results
Sample Results
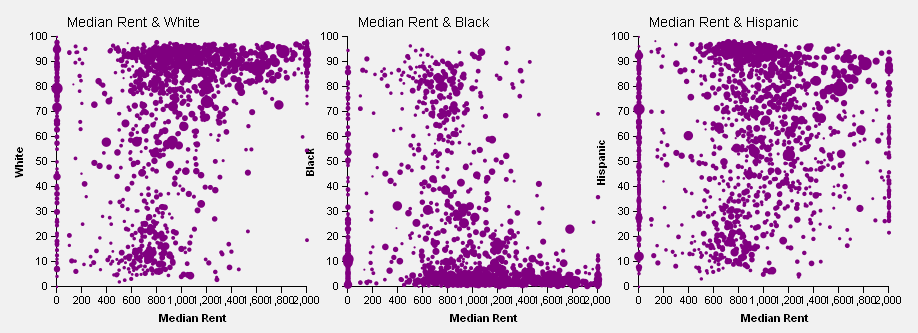
What Can We Learn?
The "center" shows the median values
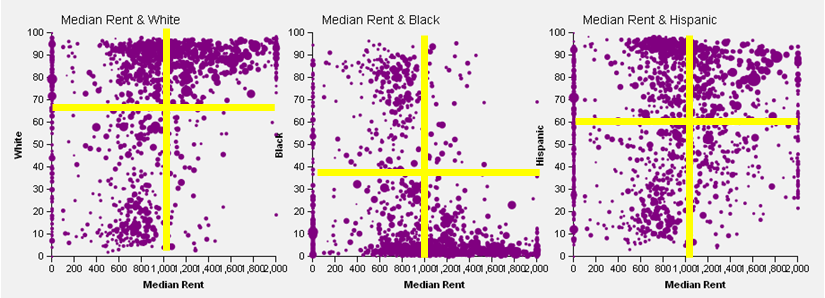
The "direction" shows the trend
The "spread" shows variability. A wider range shows more variability than a compact area.
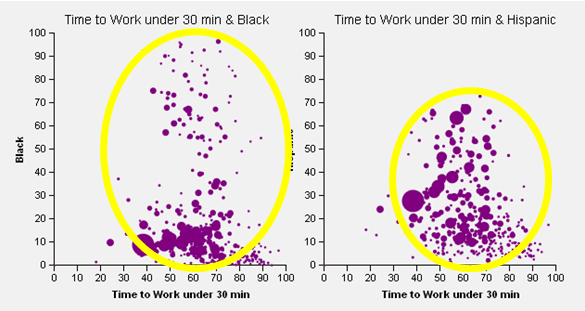
The "outliers" are anomalies. Should they be examined further?
DIY Scatterplot Maker -- Try it Yourself!
Explore 2010 census block group data in your county with this easy-to-use web tool.
- Geographic Unit is Census Block Group
- Economic Data is Shown in Dollar Values
- All Other Data is Shown by Percentages
- Circle size is scaled according to the total population of the Block Group